
The Real Breakdown of Cost Per Click Across Social Platforms

What Is Cost Per Click and How Platform Auctions Work
Cost per click (CPC) measures the precise amount an advertiser pays each time a user clicks on an ad link. The mathematical calculation is straightforward:
$$\text{CPC} = \frac{\text{Total Ad Spend}}{\text{Total Link Clicks}}$$
While the formula is simple, the pricing mechanism behind it is dynamic. Social platforms rely on real-time auctions rather than static rate cards. When an ad slot opens in a user’s feed, algorithms evaluate every eligible advertiser’s bid type, target audience, and ad relevance within milliseconds.

Advertisers can choose between manual bidding—setting a strict maximum CPC cap—or automated bidding strategies (such as Meta’s Advantage+ or LinkedIn’s Maximum Delivery). Automated bidding uses machine learning to dynamically adjust bids to capture clicks based on projected conversion likelihood.
CPC vs CPM: Core Differences in Bidding Models
Understanding the distinction between CPC and CPM (Cost Per Mille, or cost per 1,000 impressions) determines how your ad budget is deployed:
- CPC (Cost Per Click): You are charged only when a user interacts with your link. This model is ideal for direct-response marketing, lead generation, and driving outbound website traffic.
- CPM (Cost Per Mille): You pay for impressions regardless of user interaction. CPM is standard for brand awareness campaigns, video reach, and top-of-funnel visibility.
While CPM buys sheer ad real estate, CPC ensures financial accountability by tying spend directly to traffic. However, platforms ultimately clear auctions based on impression value. A high click-through rate (CTR) directly reduces your effective CPC under an impression-based auction system.
Auction Mechanics: Quality Scores and Estimated Action Rates
Social ad platforms operate on a total value auction model. The highest monetary bid does not always win the best placement. Instead, networks rank ads using a combined scoring equation:
$$\text{Total Value} = \text{Advertiser Bid} + \text{Estimated Action Rate} + \text{Ad Quality & Relevance}$$
- Advertiser Bid: The maximum amount you are willing to spend for the desired action.
- Estimated Action Rate: The algorithm’s predictive model assessing how likely a user is to click, convert, or watch your creative.
- Ad Quality & Relevance Score: User feedback signals, post-click landing page speed, engagement history, and negative feedback (such as users hiding or reporting the ad).
When an ad exhibits high engagement and top-tier creative relevance, the platform rewards the advertiser by lowering the clearing price. You can outbid competitors with larger budgets simply by running compelling, high-converting creative that platform algorithms favor.
Cost Per Click Social Media Benchmarks Across Major Platforms
Understanding industry-wide baseline metrics is essential for budgeting effectively. According to comprehensive 2026 cross-channel PPC benchmark data, paid social pricing varies dramatically based on user intent and ad format.
| Platform | Average CPC (2026) | Average CPM (2026) | Average CTR | Primary Strength |
|---|---|---|---|---|
| Meta (Facebook) | $0.70 – $1.92 | $11.00 – $14.19 | 1.40% – 1.80% | Broad reach & advanced conversion AI |
| Meta (Instagram) | $0.20 – $2.00 | $6.70 – $10.50 | 1.20% – 1.65% | Visual engagement & Reels inventory |
| TikTok | $0.30 – $1.00 | $4.00 – $10.00 | 1.77% – 2.10% | Gen Z/Millennial engagement & TikTok Shop |
| $5.26 – $11.04 | $33.00 – $65.00 | 0.57% – 0.69% | Hyper-targeted B2B decision-makers | |
| $0.10 – $1.50 | $2.00 – $5.00 | 0.15% – 0.25% | High purchase-intent visual discovery | |
| Snapchat | $0.40 – $0.84 | $3.00 – $6.00 | 1.04% – 1.30% | Cost-efficient young adult reach |
| X (Twitter) | $0.50 – $2.00 | $5.00 – $9.50 | 0.80% – 1.20% | Real-time conversations & trending events |
For an in-depth breakdown of platform-specific costs and forecasting across networks, review the analysis on social media ads cost benchmarks.
Meta: Facebook and Instagram Ad Costs
Meta remains the foundational network for paid acquisition. However, targeting depth causes costs to split significantly:
- Cold Traffic Campaigns: Acquiring new users on Meta averages between $0.80 and $2.00 per click.
- Warm Retargeting: Retargeting custom audiences or catalog viewers drops CPC to $0.50 – $1.50.
- Traffic vs. Lead Objectives: Simple traffic campaigns clear at a median of $0.70, whereas on-platform or off-platform lead generation campaigns average $1.92 per click.
- Placement Arbitrage: Instagram Reels and Facebook Video placements frequently yield a 20% to 25% lower CPC compared to standard desktop feeds due to expanding video ad supply.
For detailed industry ranges, explore how much Facebook ads cost across various competitive sectors.
TikTok, LinkedIn, Pinterest, and Emerging Channels
- TikTok: Averaging a $1.00 CPC and $10.00 CPM, TikTok offers lower entry friction for direct-to-consumer (DTC) brands, with cold demographic traffic for users aged 18–34 dropping as low as $0.30 to $0.60 per click. In-app shopping via TikTok Shop continues to compress the path to purchase.
- LinkedIn: B2B campaigns demand premium pricing, with standard sponsored content averaging $5.26 to $11.04 CPC. However, format innovations like Thought Leader Ads achieve click-through rates as high as 2.68%, significantly cutting lead acquisition costs for executive audiences.
- Pinterest & Snapchat: Pinterest delivers consistent buyer-intent traffic between $0.10 and $1.50 CPC, making it a powerhouse for home decor, fashion, and lifestyle. Snapchat presents a median CPC of $0.84, offering awareness-level CPMs roughly 30% to 40% cheaper than Meta inventory.
Why Low CPC Can Mislead: The Full Profitability Equation
A low cost per click does not equal business success. In digital advertising, obsessing over ultra-cheap clicks often results in high volumes of unqualified traffic that fail to convert on-site.
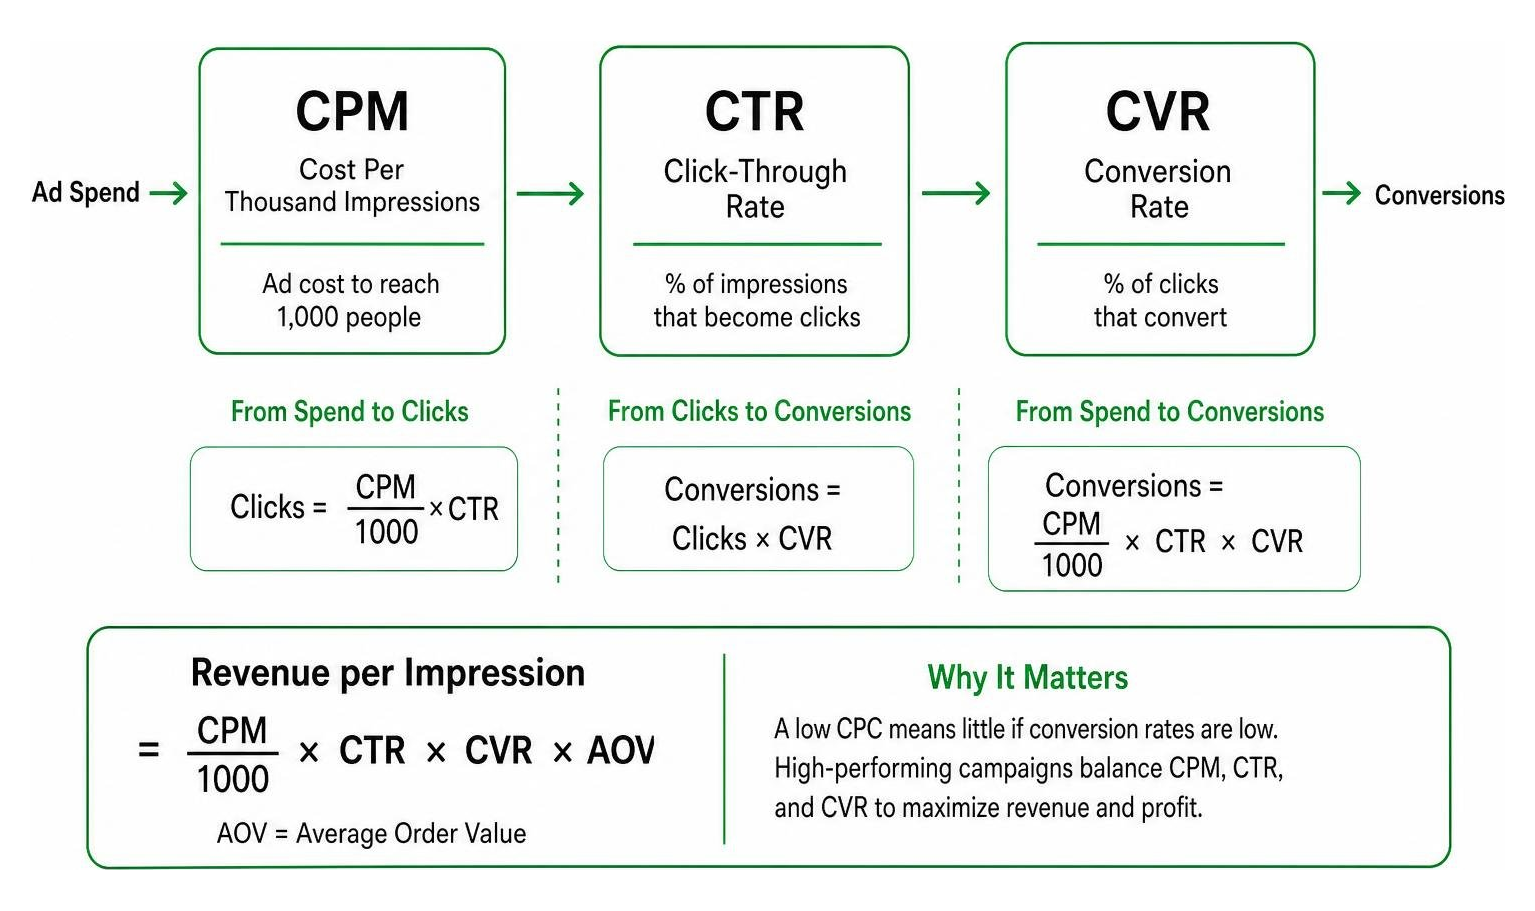
To diagnose campaign efficiency, we use the diagnostic revenue framework:
$$\text{Revenue per Impression} = \left(\frac{\text{CPM}}{1000}\right) \times \text{CTR} \times \text{CVR} \times \text{AOV}$$
If your CPC is $0.20 on a platform where conversion rates sit at 0.1%, your true cost per acquisition is substantially worse than paying a $3.00 CPC on a channel converting at 4%.
Evaluating Cost Per Click Social Media Metrics Beyond the Click
When reviewing your paid social dashboards, monitor these interconnected performance metrics:
- Click-Through Rate (CTR): Measures ad resonance and hook strength. High CTR lowers effective CPMs.
- Conversion Rate (CVR): Indicates post-click alignment. If CTR is high but CVR is low, your landing page messaging is disconnected from your ad copy.
- Cost Per Acquisition (CPA): The true baseline metric defining how much ad spend is required to generate a paying customer.
- Return on Ad Spend (ROAS): Gross revenue generated divided by ad spend. The median ROAS across Meta ecommerce brands settles around 1.86, requiring strict margin awareness.
Advertisers looking to benchmark their campaigns across top-performing channels can explore the average price per click overview for actionable funnel data.
Blended CAC Payback and Unit Economics
Profitable media buying requires understanding unit economics. Before scaling ad spend, establish your break-even customer acquisition cost (CAC):
$$\text{Break-Even CAC} = \text{Average Order Value (AOV)} \times \text{Gross Margin \%}$$
$$\text{Break-Even ROAS} = \frac{1}{\text{Gross Margin \%}}$$
Example: If your product sells for $100 with a 60% gross margin, your break-even CAC is $60. If your paid social campaigns acquire customers at a blended CAC of $40, you generate $20 of immediate contribution margin per order. Tracking your blended CAC payback window ensures your ad spend fuels sustainable cash flow.
Key Factors Driving Paid Social Costs in 2026
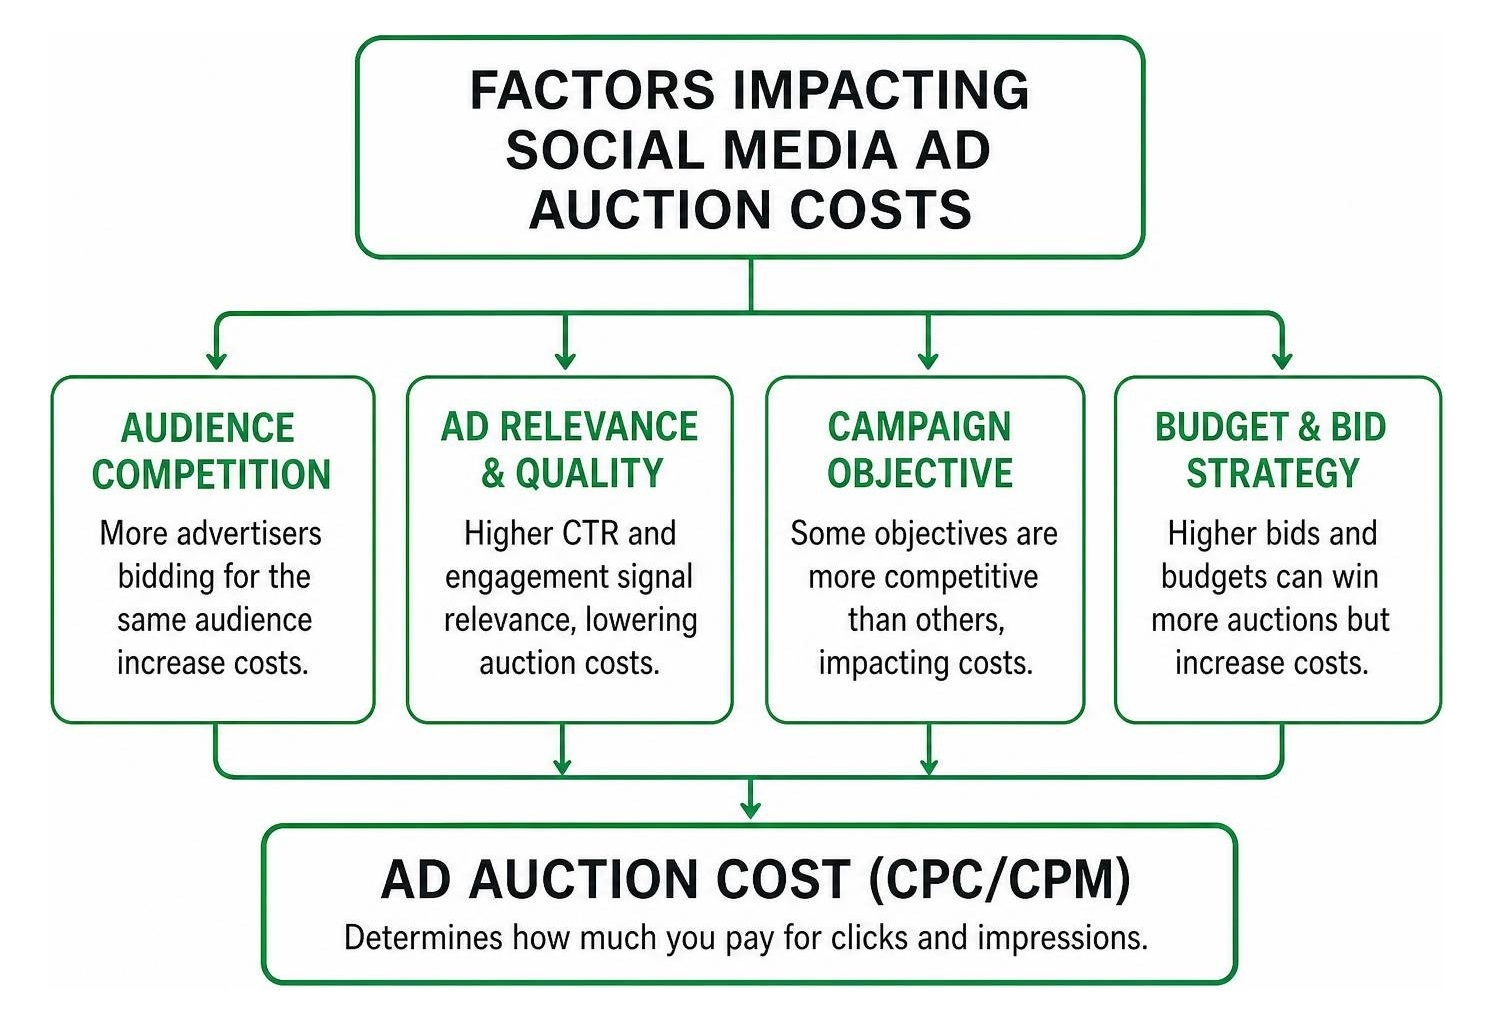
Ad costs across social networks fluctuate based on algorithmic adjustments, regional economics, and auction competition. According to recent findings in the social media ads benchmarks analysis, worldwide median social ad spend expanded 16% year-over-year, while global CPC declined 9% to $0.191 due to enhanced ad delivery efficiency.
Industry Verticals and Campaign Objective Impacts
Costs vary significantly by industry due to customer lifetime value (LTV) and sector competition:
- Ecommerce & Retail: Ecommerce ad spend surged 70% year-over-year, driving average CPC down 18% to $0.133—the most cost-efficient vertical tracked.
- B2B SaaS & Tech: High competitive bidding pushes average CPC to $3.50 – $8.00+.
- Legal & Financial Services: High-intent keywords and high transaction values elevate costs to $3.45 – $5.00+ per click.
- Local Home Services: Moderately competitive, averaging $1.20 – $2.50 per click when targeted within defined geographic radii.
Campaign objectives also dictate auction priority. Bidding for standard link clicks allows algorithms to seek out the cheapest available users. Bidding for bottom-funnel conversions (Purchases or Leads) directs the platform toward high-intent buyers, which raises initial CPC but drives a lower overall CPA.
AI-Driven Bidding, Reels Arbitrage, and Social Commerce Trends
Three structural shifts dominate modern social advertising:
- AI-Driven Campaign Infrastructure: Tools like Meta Advantage+ and TikTok Smart Performance campaigns automate creative variation, placement, and audience segmentation, lowering manual campaign overhead.
- Short-Form Video Arbitrage: Vertical video formats across Instagram Reels, YouTube Shorts, and TikTok continue to receive preferential algorithm distribution, offering lower impression costs than static desktop feeds.
- In-App Social Commerce: Frictionless checkouts inside TikTok Shop and Meta platforms shorten customer journeys, minimizing drop-offs from slow-loading external mobile sites.
Integrating social ads alongside a holistic search strategy from a digital marketing SEO agency ensures your brand captures high-intent demand generated by your paid social visibility.
Proven Tactics to Lower Paid Ad Costs and Maximize Value
Lowering your social media ad costs does not mean slashing budgets—it means increasing creative efficiency and platform relevancy.
How to Lower Your Cost Per Click Social Media Ad Spend
To improve performance across your paid campaigns:
- Improve Creative Hook Rates: The first 2 to 3 seconds of vertical video dictate your ad’s auction relevance score. Test 3–5 distinct visual and text hooks for every core video concept to stop users from scrolling.
- Combat Ad Fatigue: Refresh ad creative every 2 to 3 weeks. When frequency climbs above 3.0 to 4.0 in cold audiences, CTR drops and platform auctions penalize your ad sets with higher CPCs.
- Consolidate Ad Sets: Avoid fracturing your budget across dozens of micro-audiences. Broad audience targeting allows AI bidding models to locate the lowest-cost conversions freely.
- Align Post-Click Landing Pages: A seamless mobile landing page that loads in under 2 seconds directly boosts your quality score. Supporting paid acquisition with expert SEO services creates a frictionless experience that turns clicks into conversions.
Marketers seeking campaign frameworks can explore actionable digital marketing resources to refine their attribution models and audience tracking.
Testing Budgets and Platform Selection for Small Businesses
A common mistake is spreading a small ad budget too thin across multiple platforms. Platform algorithms require data density to optimize delivery.
Meta, for example, requires roughly 50 conversion events per ad set per week to exit its algorithmic learning phase. If your target CPA is $20, an ad set requires at least $1,000 per week ($140/day) to stabilize.
We recommend a structured 90-day testing ladder for small businesses:
- Days 1–14 (Learning & Signal Phase): Allocate $30–$50/day into 1–2 consolidated campaigns to validate audience engagement and gather baseline conversion data.
- Days 15–45 (Creative Winner Finding): Introduce new creative angles and hook variations against your top-performing ad sets, pausing any creative with below-average CTRs.
- Days 46–90 (Scaling & Profitability): Scale daily budgets by 15–20% every 3–4 days on verified winning ad sets while expanding into retargeting and secondary placements.
Frequently Asked Questions About Social Media Ad Costs
What is the cheapest social media platform to advertise on in 2026?
Pinterest and Snapchat generally offer the lowest entry CPCs and CPMs for broad brand awareness campaigns, frequently averaging between $0.10 and $0.84 per click. TikTok also delivers low CPCs ($0.30–$0.60) for cold top-of-funnel consumer audiences. However, lowest click cost does not equate to highest return—always evaluate channel performance by target CPA and conversion rates.
What is a realistic monthly testing budget for paid social?
A realistic testing budget for a small-to-midsize business is $1,500 to $3,000 per month concentrated on a single primary platform (such as Meta or LinkedIn). This provides sufficient daily spend ($50–$100/day) to clear algorithmic learning phases, test 4–6 creative variations, and gather statistically significant conversion metrics.
Why are my social media ad costs increasing?
Ad costs typically rise due to three factors:
- Creative Fatigue: The audience has seen your ad multiple times, leading to declining CTR and higher auction penalties.
- Q4 Seasonality Spikes: Increased enterprise ad spend during holidays pushes auction CPMs up 20% to 50% across all platforms.
- Post-Click Disconnect: High bounce rates on landing pages signal poor ad relevance to platform algorithms, increasing your baseline CPC.
Conclusion
Understanding your cost per click across social media platforms is the first step toward building a predictable customer acquisition engine. CPC provides immediate feedback on ad creative resonance, audience fit, and auction dynamics—yet sustainable growth happens when you connect top-of-funnel click efficiency directly to conversion rate optimization, average order value, and blended CAC payback.
Whether you are scaling direct-to-consumer ecommerce sales, generating qualified B2B leads, or dominating a local market, we build conversion-focused ad management and organic growth systems tailored to your bottom line. Ready to scale profitably? Connect with our team to explore our comprehensive digital marketing services today.